I added this on March 7th. 2016, in response to
a request I received from a student at Auburn
( Go Tigers !!!)
My name is Christian and I am working on a project
for my Data Visualization class.
It requires I tell a story using different data sets.
I have decided to tell a story about the increasing
amount of money spent on entertainment over the years.
If there is any way that I could get access to your Database
to use in my visualization I would greatly appreciate it.

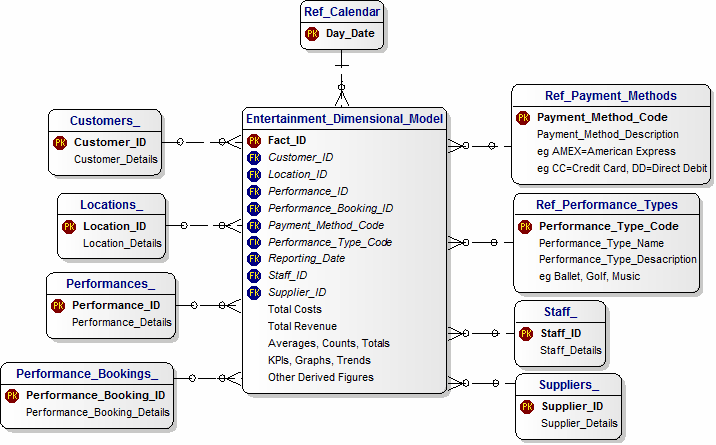
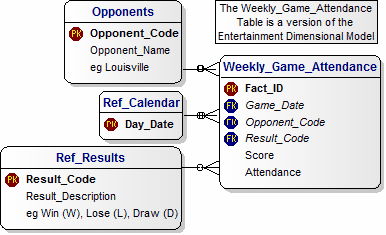
I derived the design of the Auburn Data Mart from the Entertainment Dimensional Model shown above.
I use it to store only the data I need of Game Date, Opponent, Result, Score and Weekly Attendance.
I found this data on the Auburn Football Web Site.
  Date            Opponent W/L Score Attendance
Sep 05, 2015 vs Louisville W 31-24 73927
Sep 12, 2015 JACKSONVILLE STATE W 27-20 87451
* Sep 19, 2015 at #13 LSU L 21-45 102321
* Sep 26, 2015 MISSISSIPPI STATE L 9-17 87451
Oct 03, 2015 SAN JOSE STATE W 35-21 87451
* Oct 15, 2015 at Kentucky W 30-27 63407
* Oct 24, 2015 at Arkansas L 46-54 72008
* Oct 31, 2015 #19 OLE MISS L 19-27 87451
* Nov 07, 2015 at #25 Texas A&M; W 26-10 104625
* Nov 14, 2015 GEORGIA L 13-20 87451
Nov 21, 2015 IDAHO W 56-34 87451
* Nov 28, 2015 #2 ALABAMA L 13-29 87451|